|
|
|
1 |
8 |
7 |
56 |
1 |
1 |
8 |
0.125 |
|
|
|
|
|
|
|
|
|
|
|
|
2 |
7 |
12 |
84 |
2 |
5 |
8 |
0.625 |
|
|
|
|
|
|
|
|
|
|
|
|
3 |
12 |
6 |
72 |
3 |
3 |
5 |
0.6 |
|
|
|
|
|
|
|
|
|
|
|
|
4 |
12 |
7 |
84 |
4 |
1 |
5 |
0.2 |
|
|
|
|
|
|
|
|
|
|
|
|
5 |
7 |
8 |
56 |
5 |
7 |
10 |
0.7 |
|
|
|
|
|
|
|
|
|
|
|
|
6 |
8 |
6 |
48 |
6 |
3 |
8 |
0.375 |
|
|
|
|
|
|
|
|
|
|
|
|
7 |
7 |
7 |
49 |
7 |
9 |
10 |
0.9 |
|
|
|
|
|
|
|
|
|
|
|
|
8 |
11 |
12 |
132 |
8 |
1 |
10 |
0.1 |
|
|
|
|
|
|
|
|
|
|
|
|
9 |
6 |
7 |
42 |
9 |
1 |
4 |
0.25 |
|
|
|
|
|
|
|
|
|
|
|
|
10 |
8 |
9 |
72 |
10 |
1 |
3 |
0.3333 |
|
|
|
|
|
|
|
|
|
|
|
|
11 |
9 |
6 |
54 |
11 |
1 |
9 |
0.1111 |
|
|
|
|
|
|
|
|
|
|
|
|
12 |
7 |
4 |
28 |
12 |
3 |
4 |
0.75 |
|
|
|
|
|
|
|
|
|
|
|
|
13 |
8 |
8 |
64 |
13 |
1 |
6 |
0.1666 |
|
|
|
|
|
|
|
|
|
|
|
|
14 |
12 |
8 |
96 |
14 |
1 |
2 |
0.5 |
|
|
|
|
|
|
|
|
|
|
|
|
15 |
9 |
12 |
108 |
15 |
2 |
3 |
0.6666 |
|
|
|
|
|
|
|
|
|
|
|
|
16 |
6 |
8 |
48 |
16 |
3 |
10 |
0.3 |
|
|
|
|
|
|
|
|
|
|
|
|
17 |
6 |
9 |
54 |
|
|
|
|
|
|
|
|
|
|
|
|
|
|
|
|
18 |
12 |
11 |
132 |
|
|
|
|
|
|
|
|
|
|
|
|
|
|
|
|
19 |
12 |
9 |
108 |
|
|
|
|
|
|
|
|
|
|
|
|
|
|
|
|
20 |
11 |
11 |
121 |
|
|
|
|
|
|
|
|
|
|
|
|
|
|
|
|
21 |
9 |
7 |
63 |
|
|
|
|
|
|
|
|
|
|
|
|
|
|
|
|
22 |
9 |
8 |
72 |
|
|
|
|
|
|
|
|
|
|
|
|
|
|
|
|
23 |
7 |
6 |
42 |
|
|
|
|
|
|
|
|
|
|
|
|
|
|
|
|
24 |
6 |
12 |
72 |
|
|
|
|
|
|
|
|
|
|
|
|
|
|
|
|
25 |
12 |
12 |
144 |
|
|
|
|
|
|
|
|
|
|
|
|
|
|
|
|
26 |
4 |
8 |
32 |
|
|
|
|
|
|
|
|
|
|
|
|
|
|
|
|
27 |
8 |
4 |
32 |
|
|
|
|
|
|
|
|
|
|
|
|
|
|
|
|
28 |
8 |
12 |
96 |
|
|
|
|
|
|
|
|
|
|
|
|
|
|
|
|
|
|
|
|
|
|
|
|
|
|
|
|
|
|
|
|
|
|
|
|
|
|
|
|
|
|
|
|
|
|
|
|
|
|
|
|
|
|
|
|
|
|
|
|
|
|
|
|
|
|
|
|
|
|
|
|
|
|
|
|
|
|
|
|
|
|
|
|
|
|
|
|
|
|
|
|
|
|
|
|
|
|
|
|
|
|
|
|
|
|
|
|
|
|
|
|
|
|
|
|
|
|
|
|
|
|
|
|
|
|
|
|
|
|
|
|
|
|
|
|
|
|
|
|
|
|
|
|
|
|
|
|
|
|
|
|
|
|
|
|
|
|
|
|
|
|
|
|
|
|
|
|
|
|
|
|
|
|
|
|
|
|
|
|
|
|
|
|
|
|
|
|
|
|
|
|
|
|
|
|
|
|
|
|
|
|
|
|
|
|
|
|
|
|
|
|
|
|
|
|
|
|
|
|
|
|
|
|
|
|
|
|
|
|
|
|
|
|
|
|
|
|
|
|
|
|
|
|
|
|
|
|
|
|
|
|
|
|
|
|
|
|
|
|
|
|
|
|
|
|
|
|
|
|
|
|
|
|
|
|
|
|
|
|
|
|
|
|
|
|
|
|
|
|
|
|
|
|
|
|
|
|
|
|
|
|
|
|
|
|
|
|
|
|
|
|
|
|
|
|
|
|
|
|
|
|
|
|
|
|
|
|
|
|
|
|
|
|
|
|
|
|
|
|
|
|
|
|
|
|
|
|
|
|
|
|
|
|
|
|
|
|
|
|
|
|
|
|
|
|
|
|
|
|
|
|
|
|
|
|
|
|
|
|
|
|
|
|
|
|
|
|
|
|
|
|
|
|
|
|
|
|
|
|
|
|
|
|
|
|
|
|
|
|
|
|
|
|
|
|
|
|
|
|
|
|
|
|
|
|
|
|
|
|
|
|
|
|
|
|
|
|
|
|
|
|
|
|
|
|
|
|
|
|
|
|
|
|
|
|
|
|
|
|
|
|
|
|
|
|
|
|
|
|
|
|
|
|
|
|
|
|
|
|
|
|
|
|
|
|
|
|
|
|
|
|
|
|
|
|
|
|
|
|
|
|
|
|
|
|
|
|
|
|
|
|
|
|
|
|
|
|
|
|
|
|
|
|
|
|
|
|
|
|
|
|
|
|
|
|
|
|
|
|
|
|
|
|
|
|
|
|
|
|
|
|
|
|
|
|
|
|
|
|
|
|
|
|
|
|
|
|
|
|
|
|
|
|
|
|
|
|
|
|
|
|
|
|
|
|
|
|
|
|
|
|
|
|
|
|
|
|
|
|
|
|
|
|
|
|
|
|
|
|
|
|
|
|
|
|
|
|
|
| Name: |
|
StudentID: |
|
Quiz: |
13 |
|
Grade: |
|
|
|
|
|
|
|
|
|
|
|
|
|
|
|
|
|
|
|
|
|
|
|
|
|
| School: |
|
TeacherID: |
|
QuizID: |
EQ28 |
|
|
|
|
|
|
|
Answer as many of the following questions as you can. |
Do not use a calculator for any of the problems. |
|
|
|
|
|
| 1 |
|
|
|
|
|
|
|
|
|
|
Show/Hide |
|
× |
|
|
|
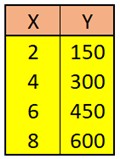 |
Determine the rate of change for the data in the table.
Points: (2,150), (4,300), (6,450), (8,600) |
|
|
|
|
|
|
|
|
|
|
|
|
|
|
|
|
|
|
|
|
|
|
|
|
|
A |
150 |
|
|
|
|
|
|
|
|
|
|
|
|
|
|
|
|
B |
50 |
|
|
|
|
|
|
|
|
|
|
|
|
|
|
|
|
C |
75 |
|
|
|
|
|
|
|
|
|
|
|
|
|
|
|
|
D |
2/150 |
|
|
|
|
|
|
|
|
|
|
|
|
|
|
|
| |
|
|
|
|
|
|
|
|
|
|
|
|
|
|
|
|
|
|
|
| 2 |
|
|
|
|
|
|
|
|
|
|
Show/Hide |
|
|
|
|
|
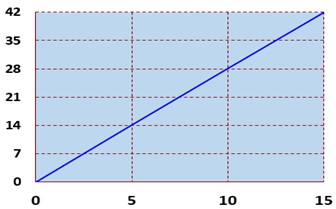
Find the rate of change represented in the graph.
Points: (0,0), (5,14), (10,28), (15,42) |
 |
|
|
|
|
|
|
|
|
|
|
|
|
|
|
|
|
|
|
|
|
|
|
|
|
|
A |
-5/14 |
|
|
|
|
|
|
|
|
|
|
|
|
|
|
|
|
B |
-2.8 |
|
|
|
|
|
|
|
|
|
|
|
|
|
|
|
|
C |
5/14 |
|
|
|
|
|
|
|
|
|
|
|
|
|
|
|
|
D |
2.8 |
|
|
|
|
|
|
|
|
|
|
|
|
|
|
|
|
|
|
|
|
|
|
|
|
|
|
|
|
|
|
|
|
|
|
|
| 3 |
|
|
|
|
|
|
|
|
|
|
Show/Hide |
|
|
|
|
|
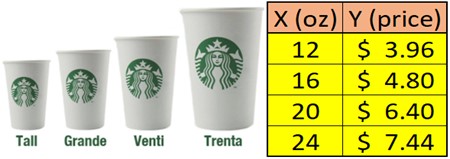 |
Find the lowest unit rate
(the best price per oz) |
|
|
|
|
|
|
|
|
|
|
|
|
|
|
|
|
|
|
|
|
|
|
|
|
|
A |
12 oz at $3.96 |
|
|
|
|
|
|
B |
16 oz at $4.80 |
|
|
|
|
|
|
C |
20 oz at $6.40 |
|
|
|
|
|
|
D |
24 oz at $7.44 |
|
|
|
|
|
|
|
|
|
|
|
|
|
|
|
|
|
|
|
|
|
|
|
|
|
| 4 |
|
|
|
|
|
|
|
|
|
|
Show/Hide |
|
|
|
|
|
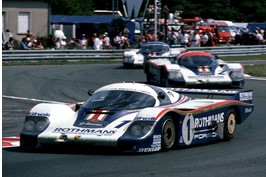
Find the largest unit rate
(km/h) |
 |
|
|
|
|
|
|
|
|
|
|
|
|
|
|
|
|
|
|
|
|
|
|
|
|
|
A |
300 Km in 1.5 hours |
|
|
|
|
|
|
B |
416 Km in 2.1 hours |
|
|
|
|
|
|
C |
349 Km in 1.75 hours |
|
|
|
|
|
|
D |
394 Km in 2.0 hours |
|
|
|
|
|
|
|
|
|
|
|
|
|
|
|
|
|
|
|
|
|
|
|
|
|
| 5 |
|
|
|
|
|
|
|
|
|
|
Show/Hide |
|
|
|
|
|
| If the points (15,9) and (30,18) belong to a proportional relationship, what is the constant of proportionality? |
|
|
|
|
|
|
|
|
|
|
|
|
|
|
|
|
|
|
|
|
|
|
|
|
|
A |
0.5 |
|
|
|
|
|
|
|
|
|
|
|
|
|
|
|
|
|
B |
1.2 |
|
|
|
|
|
|
|
|
|
|
|
|
|
|
|
|
|
C |
1.5 |
|
|
|
|
|
|
|
|
|
|
|
|
|
|
|
|
|
D |
0.6 |
|
|
|
|
|
|
|
|
|
|
|
|
|
|
|
|
|
|
|
|
|
|
|
|
|
|
|
|
|
|
|
|
|
|
|
|
| 6 |
|
|
|
|
|
|
|
|
|
|
Show/Hide |
|
|
|
|
|
| If six gallons of gas costs $13.50, how many gallons could you purchase for $45? |
|
|
|
|
|
|
|
|
|
|
|
|
|
|
|
|
|
|
|
|
|
|
|
|
|
A |
24 gal |
|
|
|
|
|
|
|
|
|
|
|
|
|
|
|
|
B |
22 gal |
|
|
|
|
|
|
|
|
|
|
|
|
|
|
|
|
C |
20 gal |
|
|
|
|
|
|
|
|
|
|
|
|
|
|
|
|
D |
18 gal |
|
|
|
|
|
|
|
|
|
|
|
|
|
|
|
|
|
|
|
|
|
|
|
|
|
|
|
|
|
|
|
|
|
|
|
| 7 |
|
|
|
|
|
|
|
|
|
|
Show/Hide |
|
|
|
|
|
| Which of the following has a constant of proportionality > 3 |
|
|
|
|
|
|
|
|
|
|
|
|
|
|
|
|
|
|
|
|
|
|
|
|
|
A |
Y - 5X = 0 |
|
|
|
|
|
|
|
|
|
|
|
|
|
|
|
B |
Y + 5X = 0 |
|
|
|
|
|
|
|
|
|
|
|
|
|
|
|
C |
Y - 5X + 2 = 0 |
|
|
|
|
|
|
|
|
|
|
|
|
|
|
|
D |
Y + 5X + 2 = 0 |
|
|
|
|
|
|
|
|
|
|
|
|
|
|
|
|
|
|
|
|
|
|
|
|
|
|
|
|
|
|
|
|
|
|
| 8 |
|
|
|
|
|
|
|
|
|
|
Show/Hide |
|
|
|
|
|
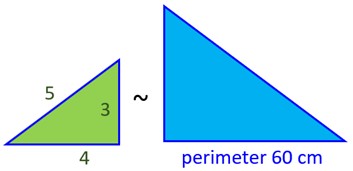
| The sides of a triangle are in ratio 3:4:5. What is the length of each side of the triangle if the perimeter of the larger triangle is 60 inches? |
 |
|
|
|
|
|
|
|
|
|
|
|
|
|
|
|
|
|
|
|
|
|
|
|
|
|
A |
The lengths of the sides are 14 in, 22 in and 24 in |
|
|
|
|
|
|
B |
The lengths of the sides are 12 in, 20 in and 28 in |
|
|
|
|
|
|
C |
The lengths of the sides are 15 in, 20 in and 25 in |
|
|
|
|
|
|
D |
The lengths of the sides are 12 in, 22 in and 26 in |
|
|
|
|
|
|
|
|
|
|
|
|
|
|
|
|
|
|
|
|
|
|
|
|
|
| 9 |
|
|
|
|
|
|
|
|
|
|
Show/Hide |
|
|
|
|
|
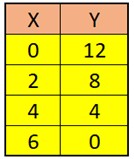 |
Find the rule for the linear function in the table. |
|
|
|
|
|
|
|
|
|
|
|
|
|
|
|
|
|
|
|
|
|
|
|
|
|
A |
Y = 2X + 12 |
|
|
|
|
|
|
|
|
|
|
|
|
|
|
|
B |
Y = -2X+12 |
|
|
|
|
|
|
|
|
|
|
|
|
|
|
|
C |
Y= 3X + 12 |
|
|
|
|
|
|
|
|
|
|
|
|
|
|
|
D |
Y = -3X+12 |
|
|
|
|
|
|
|
|
|
|
|
|
|
|
|
|
|
|
|
|
|
|
|
|
|
|
|
|
|
|
|
|
|
|
| 10 |
|
|
|
|
|
|
|
|
|
|
Show/Hide |
|
|
|
|
|
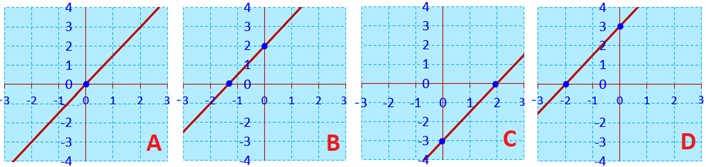
| Which graph best represents the equation Y = 1.5 X + 3 |
|
|
|
|
|
|
 |
|
|
|
|
|
A |
|
|
|
|
|
B |
|
|
|
|
|
C |
|
|
|
|
|
D |
|
|
|
|
|
|
|
|
|
|
|
|
|
|
|
|
|
|
|
|
|
|
|
|
|
|
|
|
|
|
|
|
|
|
|
© Ms Garcia Math |
|
|
|
|
|
|
|
|
|
|
|
|
|
|
|
|
|
|
|
|
|