|
GRAPHING RATIO TABLES |
|
|
|
|
Objective: |
Show/Hide |
|
The student will be able to graph the pairs of values displayed in a ratio table, and interpret the points on the graph within the context of the related word problem. |
|
|
|
|
Standards: |
Show/Hide |
|
7.4 Proportionality. The student applies mathematical process standards to represent and solve problems involving proportional relationships. The student is expected to:
(A) represent constant rates of change in mathematical & real-world problems given pictorial, tabular, verbal, numeric, graphical, & algebraic representations, including d = rt; |
|
|
|
|
Success Criteria: |
Show/Hide |
|
Understand and use graphs of equivalent ratio tables in mathematical applications of daily life.
Decide whether two quantities are in a proportional relationship by graphing on a coordinate plane. |
|
|
|
|
Definition: |
Show/Hide |
|
A ratio table is a list of equal value (equivalent) ratios.
A Proportional Relationship is a direct variation between two variables. If one varies then another varies in proportion (the two variables always have the same ratio in relation to each other).
The graph of a proportional relationship is a straight line through the origin.
All proportional relationships are in the form Y=mX.
Y=mX is the equation for a proportional relationship. |
 |
|
|
|
|
Mini Lesson: |
Show/Hide |
|
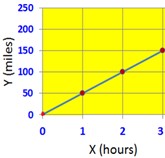
My dad is an engineer and makes some drawings on graph paper that he calls XY graphs.
He told me that the XY graphs have two axes. The horizontal axis is called x and grows to the right. The vertical axis is called Y, and it grows upwards. Where the two axes intersect is called origin.
The graph XY is also known as the coordinate plane.
The grid of the Graph XY allows us to locate specific points by defining the values of X and Y.
An ordered pair is a pair of numbers such as (1,5) that are used to locate a point in the coordinate plane. The x coordinate corresponds to a number on the x-axis (in this example 1). The Y coordinate corresponds to a number on the y-axis (in this example 5).
Each pair of values in a ratio table would correspond to a point in Graph XY.
If we join these points with a line, we see that it is a straight line that passes through the origin.
In this graph, we see that the cost is proportional to the number of tickets that were purchased.
|
 |
|
|
|
|
Equivalent Ratio Tables in Daily Life: |
Show/Hide |
|
Frequently the sellers of a single product (for example tickets for a movie theater) have next to them tables that indicate how much to charge for different quantities of products (Ex. 1 ticket=$5, 2 tickets=$10, 3 tickets=$15, etc.).
Chefs also use tables to know the quantities of ingredients in a recipe when handling different amounts of people. For example if you have the amount of ingredients in the recipe for 4 people and you want to know the amount of ingredients for 10, 20, 50 or 100 people.
In currency exchange houses, conversion tables are used to know for example: What is the amount of pesos for X (different amounts of) dollars. |
|
|
|
|
Vocabulary: |
Show/Hide |
|
Ratio: is a comparison between a pair of numbers. We can write the ratio as a fraction, where the top (numerator) is one value, and the bottom (denominator) is the other value.
Equivalent ratios: are ratios that show the same relationship between the two quantities (they have the same numerical value).
Scaling. To multiply or divide numerator and denominator of a ratio by the same number.
Ratio Table. A table with columns filled with pairs of numbers that have the same ratio. The first number is the x-coordinate, and the second number is the y-coordinate.
Graph. The pairs of numbers in the ratio table can be graphed onto a coordinate plane. All the points of a ratio table fall on a straight line, that starts at the origin and extends infinitely in the positive direction. |
|
|
|
|
Resources: (from MsGarciaMath) |
Show/Hide |
|
Constant of Proportionality 1 |
Video |
|
Constant of Proportionality 2 |
Video |
|
EQ10 Constant of proportionality from the equations |
Worksheet |
|
EQ11 Find the constant of proportionality for each graph |
Worksheet |
|
EQ12 Find the constant of proportionality from the table |
Worksheet |
|
EQ13 Fill in the tables based on their constant of proportionality |
Worksheet |
|
PP06 Directly Proportional Word Problems |
Worksheet |
|
|
|
|
Example Problems: |
Show/Hide |
|
Mike, my older brother, works mowing lawns on vacation to save for college. Last week he worked 5 days and earned $250. He needs $900 to enroll in college. At this rate, how many days he needs to work to pay this amount? |
Solution |
|
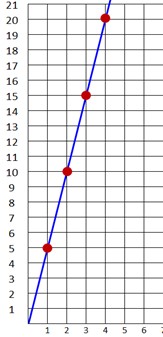
The following coordinates represent the number of teaspoons of baking powder that is required for a given number of cups of flour.
(2,3) (4,6) (6,9) (8,12).
Build the corresponding XY graph on graph paper, plot the coordinates and join them with a straight line.
Do not forget to put labels on the coordinate axes.
How many teaspoons of baking powder is required for 10 cups of flour? |
Solution |
|
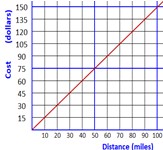
The following graph shows the cost of a taxi ride depending on the number of miles traveled.
|
 |
|
How far can I travel by taxi if I only have $ 120? |
Solution |
|
Jorge is saving $ 15 per week to buy a Smartphone that is priced at $ 180, including tax. The equation
Y = 15 X represents the total amount of money he saves in X weeks.
In how many weeks he will have saved the required amount of money? |
Solution |
|
|
|
|
|