|
Ms. Garcia Math |
|
|
|
|
|
|
|
|
|
|
|
|
|
|
|
|
|
|
|
|
|
|
Tables and Graphs of Linear Equations (Examples) |
|
|
|
|
|
|
|
|
|
|
|
|
|
|
|
|
|
|
|
|
|
|
|
|
|
|
|
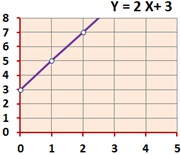
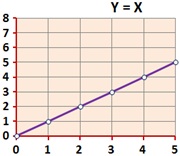
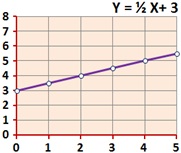
To graph a function such as Y=mX+b, we can select a table of values, plot and connect the points. |
|
|
|
|
|
|
|
|
|
|
|
|
|
|
|
|
|
|
|
|
|
|
|
|
|
|
|
|
|
|
|
 |
|
|
|
|
|
|
|
|
 |
|
|
|
X |
Y=2X+3 |
|
|
|
X |
|
|
|
|
X |
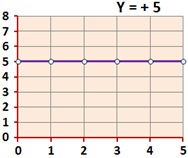
Y = 5 |
|
|
|
|
|
0 |
3 |
|
|
|
0 |
3 |
|
|
|
0 |
5 |
|
|
|
|
|
1 |
5 |
|
|
|
1 |
5 |
|
|
|
1 |
5 |
|
|
|
|
|
2 |
7 |
|
|
|
2 |
7 |
|
|
|
2 |
5 |
|
|
|
|
|
3 |
9 |
|
|
|
3 |
9 |
|
|
|
3 |
5 |
|
|
|
|
|
|
|
|
|
|
|
|
|
|
|
|
|
|
|
|
|
|
|
|
|
|
|
|
|
|
|
|
|
|
|
|
|
|
|
|
|
|
|
|
|
|
|
|
|
|
 |
|
|
|
|
|
|
|
|
|
 |
|
|
|
X |
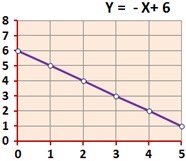
Y = - X+ 6 |
|
|
|
|
|
|
|
|
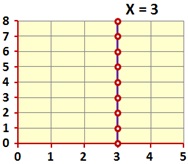
X = 3 |
Y |
|
|
|
|
|
0 |
6 |
|
|
|
|
20 |
|
|
|
3 |
0 |
|
|
|
|
|
1 |
5 |
|
|
|
|
25 |
|
|
|
3 |
1 |
|
|
|
|
|
2 |
4 |
|
|
|
|
30 |
20 |
|
|
3 |
2 |
|
|
|
|
|
3 |
3 |
|
|
|
|
35 |
|
|
|
3 |
3 |
|
|
|
|
|
|
|
|
|
|
|
|
|
|
|
|
|
|
|
|
|
|
|
|
|
|
|
|
|
|
|
|
|
|
|
|
|
|
|
|
|
|
|
|
|
|
|
|
|
|
 |
|
|
|
|
|
|
|
|
|
 |
|
|
|
X |
Y = X |
|
|
|
|
|
|
|
|
X |
Y = ½ X+ 3 |
|
|
|
|
|
0 |
0 |
|
|
|
|
|
|
|
|
0 |
3 |
|
|
|
|
|
1 |
1 |
|
|
|
|
|
|
|
|
1 |
3.5 |
|
|
|
|
|
2 |
2 |
|
|
|
|
|
|
|
|
2 |
4 |
|
|
|
|
|
3 |
3 |
|
|
|
|
|
|
|
|
3 |
4.5 |
|
|
|
|
|
|
|
|
|
|
|
|
|
|
|
|
|
|
|
|
|
|
|
|
|
|
|
|
|
|
|
|
|
|
|
|
|
|
|
|
|
|
|
|
|