|
|
N |
eq |
Supl |
X |
eq |
Supl |
X |
eq |
Supl |
X |
|
|
|
|
|
1 |
10X+44 |
16 |
12 |
2X-64 |
110 |
67 |
6X-16 |
148 |
8 |
|
|
|
|
|
2 |
5X+19 |
41 |
24 |
7X-12 |
136 |
8 |
2X-12 |
136 |
28 |
|
|
|
|
|
3 |
12X+20 |
16 |
12 |
5X-48 |
118 |
22 |
7X-20 |
144 |
8 |
|
|
|
|
|
4 |
9X+36 |
27 |
13 |
5X-20 |
140 |
12 |
7X-15 |
139 |
8 |
|
|
|
|
|
5 |
8X+44 |
24 |
14 |
8X+32 |
100 |
6 |
10X-17 |
147 |
5 |
|
|
|
|
|
6 |
4X+73 |
19 |
22 |
5X-20 |
130 |
14 |
2X-9 |
133 |
28 |
|
|
|
|
|
7 |
6X+87 |
27 |
11 |
2X-66 |
104 |
71 |
8X-13 |
137 |
7 |
|
|
|
|
|
8 |
4X+89 |
15 |
19 |
3X+14 |
157 |
3 |
11X-8 |
133 |
5 |
|
|
|
|
|
9 |
9X+71 |
10 |
11 |
9X+24 |
111 |
5 |
2X-20 |
140 |
30 |
|
|
|
|
|
10 |
3X+141 |
27 |
4 |
2X+25 |
113 |
21 |
2X-12 |
138 |
27 |
|
|
|
|
|
11 |
7X+113 |
25 |
6 |
8X-28 |
104 |
13 |
4X-16 |
148 |
12 |
|
|
|
|
|
12 |
12X+14 |
34 |
11 |
2X+17 |
153 |
5 |
5X-7 |
142 |
9 |
|
|
|
|
|
13 |
2X+94 |
28 |
29 |
4X-20 |
100 |
25 |
11X-8 |
144 |
4 |
|
|
|
|
|
14 |
11X+74 |
18 |
8 |
2X+21 |
141 |
9 |
2X-18 |
142 |
28 |
|
|
|
|
|
15 |
9X+83 |
25 |
8 |
4X+56 |
108 |
4 |
7X-14 |
138 |
8 |
|
|
|
|
|
16 |
6X+16 |
20 |
24 |
2X+10 |
166 |
2 |
4X-12 |
148 |
11 |
|
|
|
|
|
17 |
10X+87 |
33 |
6 |
8X+16 |
116 |
6 |
9X-11 |
137 |
6 |
|
|
|
|
|
18 |
4X+32 |
36 |
28 |
5X+35 |
135 |
2 |
8X-16 |
148 |
6 |
|
|
|
|
|
19 |
7X+113 |
11 |
8 |
4X+39 |
125 |
4 |
3X-7 |
133 |
18 |
|
|
|
|
|
20 |
4X+102 |
30 |
12 |
2X-30 |
140 |
35 |
2X-20 |
134 |
33 |
|
|
|
|
|
21 |
9X+53 |
19 |
12 |
2X-36 |
142 |
37 |
8X-19 |
135 |
8 |
|
|
|
|
|
22 |
12X+23 |
13 |
12 |
4X-11 |
135 |
14 |
11X-6 |
142 |
4 |
|
|
|
|
|
23 |
7X+23 |
24 |
19 |
6X+15 |
111 |
9 |
2X-12 |
140 |
26 |
|
|
|
|
|
24 |
5X+113 |
27 |
8 |
6X-20 |
128 |
12 |
12X-6 |
150 |
3 |
|
|
|
|
|
25 |
5X+118 |
17 |
9 |
8X+21 |
119 |
5 |
2X-14 |
146 |
24 |
|
|
|
|
|
26 |
6X+88 |
14 |
13 |
4X-35 |
115 |
25 |
11X-18 |
132 |
6 |
|
|
|
|
|
27 |
9X+129 |
24 |
3 |
8X-16 |
140 |
7 |
5X-5 |
145 |
8 |
|
|
|
|
|
28 |
6X+25 |
41 |
19 |
2X+38 |
110 |
16 |
12X-16 |
136 |
5 |
|
|
|
|
|
29 |
10X+99 |
11 |
7 |
3X-66 |
99 |
49 |
10X-17 |
147 |
5 |
|
|
|
|
|
30 |
12X+21 |
39 |
10 |
5X+26 |
114 |
8 |
6X-14 |
134 |
10 |
|
|
|
|
|
31 |
7X+97 |
27 |
8 |
2X-12 |
160 |
16 |
2X-20 |
142 |
29 |
|
|
|
|
|
32 |
9X+21 |
33 |
14 |
4X+50 |
106 |
6 |
4X-9 |
137 |
13 |
|
|
|
|
|
33 |
11X+93 |
10 |
7 |
2X-73 |
103 |
75 |
3X-8 |
131 |
19 |
|
|
|
|
|
34 |
3X+73 |
26 |
27 |
2X+32 |
140 |
4 |
6X-6 |
144 |
7 |
|
|
|
|
|
35 |
3X+57 |
39 |
28 |
3X-69 |
105 |
48 |
10X-18 |
148 |
5 |
|
|
|
|
|
36 |
3X+60 |
36 |
28 |
2X-30 |
136 |
37 |
4X-11 |
143 |
12 |
|
|
|
|
|
37 |
4X+81 |
11 |
22 |
9X-10 |
136 |
6 |
6X-15 |
141 |
9 |
|
|
|
|
|
38 |
10X+97 |
23 |
6 |
6X+26 |
118 |
6 |
10X-19 |
149 |
5 |
|
|
|
|
|
39 |
10X+17 |
23 |
14 |
2X-70 |
100 |
75 |
12X-16 |
136 |
5 |
|
|
|
|
|
40 |
7X+148 |
18 |
2 |
7X+23 |
129 |
4 |
8X-8 |
140 |
6 |
|
|
|
|
|
41 |
12X+48 |
24 |
9 |
2X+18 |
106 |
28 |
10X-11 |
131 |
6 |
|
|
|
|
|
42 |
9X+56 |
34 |
10 |
8X-40 |
100 |
15 |
12X-12 |
144 |
4 |
|
|
|
|
|
43 |
4X+64 |
24 |
23 |
5X+18 |
132 |
6 |
12X-15 |
147 |
4 |
|
|
|
|
|
44 |
4X+105 |
27 |
12 |
2X-52 |
116 |
58 |
11X-7 |
143 |
4 |
|
|
|
|
|
45 |
6X+81 |
39 |
10 |
2X+40 |
124 |
8 |
3X-11 |
131 |
20 |
|
|
|
|
|
46 |
2X+129 |
17 |
17 |
5X-10 |
140 |
10 |
8X-16 |
148 |
6 |
|
|
|
|
|
47 |
2X+83 |
29 |
34 |
3X-48 |
102 |
42 |
7X-11 |
149 |
6 |
|
|
|
|
|
48 |
4X+87 |
21 |
18 |
5X+30 |
130 |
4 |
2X-12 |
142 |
25 |
|
|
|
|
|
49 |
10X+90 |
40 |
5 |
2X+57 |
111 |
6 |
3X-20 |
131 |
23 |
|
|
|
|
|
50 |
11X+54 |
16 |
10 |
5X-13 |
153 |
8 |
12X-10 |
142 |
4 |
|
|
|
|
|
|
|
|
|
|
|
|
|
|
|
|
5 |
|
|
|
|
|
|
|
|
|
|
|
|
|
|
|
|
|
|
|
|
|
|
|
|
|
|
|
|
|
|
|
|
|
|
|
|
|
|
|
|
|
|
|
|
|
|
|
|
|
|
|
|
|
|
|
|
|
|
|
|
|
|
|
|
|
|
|
|
|
|
|
|
|
|
|
|
|
|
©Ms. Garcia Math |
|
|
|
|
|
|
|
|
|
|
|
|
|
|
|
|
|
|
|
| Name: |
|
ID: |
|
Quiz: |
|
Grade: |
|
|
|
|
|
|
|
|
|
|
|
|
|
|
|
|
|
|
|
|
| Benchmark 2 |
|
|
|
|
| 1 |
|
|
|
|
|
|
|
|
? |
|
|
|
|
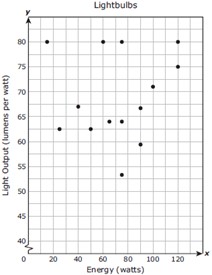
The scatterplot shows the energy in watts and the light output in lumens per watt of several lightbulbs.
Which statement best describes the association between the energy and light output of these lightbulbs? |
 |
|
|
|
|
|
|
|
|
|
|
|
|
|
|
|
|
|
|
|
|
F |
As the energy increases, the light output increases. |
|
|
|
|
|
G |
As the energy increases, the light output decreases. |
|
|
|
|
|
H |
As the energy increases, the light output remains the same. |
|
|
|
|
|
J |
There is no apparent association between the energy and light output. |
|
|
|
|
|
|
|
|
|
|
|
|
|
|
|
|
|
|
|
| 2 |
|
|
|
|
|
|
|
|
? |
|
|
|
|
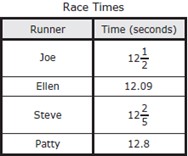
The table shows the completion times of four runners in a race.
Which list shows the runners in order by their completion times from fastest to slowest? |
 |
|
|
|
|
|
|
|
|
|
|
A |
Patty, Joe, Steve, Ellen |
|
|
|
|
|
B |
Ellen, Joe, Steve, Patty |
|
|
|
|
|
C |
Ellen, Steve, Joe, Patty |
|
|
|
|
|
D |
Patty, Steve, Joe, Ellen |
|
|
|
|
|
|
|
|
|
|
|
|
|
|
|
|
|
|
|
| 3 |
|
|
|
|
|
|
|
|
? |
|
|
|
|
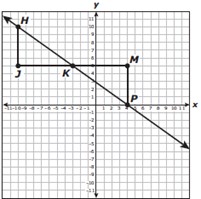
Triangle HJK and triangle PMK are similar right triangles. The coordinates of all the vertices are integers.
Which statement is true about the slope of HK and the slope of PK? |
 |
|
|
|
|
|
|
|
|
|
|
|
|
|
|
|
|
|
|
|
|
F |
The slope of HK is less than the slope of PK, because the ratio of the change in y-values of the endpoints to the change in x-values of the endpoints is less for HK than it is for PK. |
|
|
|
|
|
G |
The slope of HK is equal to the slope of PK, because the ratio of the change in y-values of the endpoints to the change in x-values of the endpoints is the same for HK as it is for PK. |
|
|
|
|
|
H |
The slope of HK is greater than the slope of PK, because the ratio of the change in y-values of the endpoints to the change in x-values of the endpoints is greater for HK than it is for PK. |
|
|
|
|
|
J |
The relationship between the slope of HK and the slope of PK cannot be determined, because the triangles are congruent. |
|
|
|
|
|
|
|
|
|
|
|
|
|
|
|
|
|
|
|
| 4 |
|
|
|
|
|
|
|
|
? |
|
|
|
|
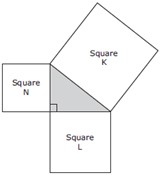
The diagram shows three squares that are joined at vertices to form a right triangle.
Which statement is true? |
 |
|
|
|
|
|
|
|
|
|
|
|
|
|
|
|
|
|
|
|
|
A |
The sum of the areas of Square N and Square L is equal to the area of Square K. |
|
|
|
|
|
B |
The sum of the areas of Square N and Square L is greater than the area of Square K. |
|
|
|
|
|
C |
The sum of the areas of Square N and Square K is equal to the area of Square L. |
|
|
|
|
|
D |
The sum of the areas of Square N and Square K is less than the area of Square L. |
|
|
|
|
|
|
|
|
|
|
|
|
|
|
|
|
|
|
|
| 5 |
|
|
|
|
|
|
|
|
? |
|
|
|
|
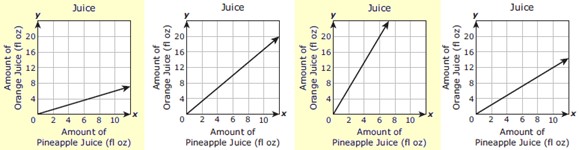
| A bottle contains 30 fluid ounces of orange juice and 18 fluid ounces of pineapple juice. Which graph has a slope that best represents the ratio of orange juice to pineapple juice in this bottle? |
|
|
|
|
|
|
|
|
|
|
|
|
|
|
|
|
|
|
|
|
 |
|
|
|
|
|
|
|
|
|
|
|
|
|
|
|
|
|
|
|
F |
|
G |
|
H |
|
J |
|
|
|
|
|
|
|
|
|
|
|
|
|
|
|
|
|
|
|
|
|
|
|
|
|
|
|
|
|
|
|
|
|
|
|
|
|
|