|
|
N |
eq |
Supl |
X |
eq |
Supl |
X |
eq |
Supl |
X |
|
|
|
|
|
1 |
10X+44 |
16 |
12 |
2X-64 |
110 |
67 |
6X-16 |
148 |
8 |
|
|
|
|
|
2 |
5X+19 |
41 |
24 |
7X-12 |
136 |
8 |
2X-12 |
136 |
28 |
|
|
|
|
|
3 |
12X+20 |
16 |
12 |
5X-48 |
118 |
22 |
7X-20 |
144 |
8 |
|
|
|
|
|
4 |
9X+36 |
27 |
13 |
5X-20 |
140 |
12 |
7X-15 |
139 |
8 |
|
|
|
|
|
5 |
8X+44 |
24 |
14 |
8X+32 |
100 |
6 |
10X-17 |
147 |
5 |
|
|
|
|
|
6 |
4X+73 |
19 |
22 |
5X-20 |
130 |
14 |
2X-9 |
133 |
28 |
|
|
|
|
|
7 |
6X+87 |
27 |
11 |
2X-66 |
104 |
71 |
8X-13 |
137 |
7 |
|
|
|
|
|
8 |
4X+89 |
15 |
19 |
3X+14 |
157 |
3 |
11X-8 |
133 |
5 |
|
|
|
|
|
9 |
9X+71 |
10 |
11 |
9X+24 |
111 |
5 |
2X-20 |
140 |
30 |
|
|
|
|
|
10 |
3X+141 |
27 |
4 |
2X+25 |
113 |
21 |
2X-12 |
138 |
27 |
|
|
|
|
|
11 |
7X+113 |
25 |
6 |
8X-28 |
104 |
13 |
4X-16 |
148 |
12 |
|
|
|
|
|
12 |
12X+14 |
34 |
11 |
2X+17 |
153 |
5 |
5X-7 |
142 |
9 |
|
|
|
|
|
13 |
2X+94 |
28 |
29 |
4X-20 |
100 |
25 |
11X-8 |
144 |
4 |
|
|
|
|
|
14 |
11X+74 |
18 |
8 |
2X+21 |
141 |
9 |
2X-18 |
142 |
28 |
|
|
|
|
|
15 |
9X+83 |
25 |
8 |
4X+56 |
108 |
4 |
7X-14 |
138 |
8 |
|
|
|
|
|
16 |
6X+16 |
20 |
24 |
2X+10 |
166 |
2 |
4X-12 |
148 |
11 |
|
|
|
|
|
17 |
10X+87 |
33 |
6 |
8X+16 |
116 |
6 |
9X-11 |
137 |
6 |
|
|
|
|
|
18 |
4X+32 |
36 |
28 |
5X+35 |
135 |
2 |
8X-16 |
148 |
6 |
|
|
|
|
|
19 |
7X+113 |
11 |
8 |
4X+39 |
125 |
4 |
3X-7 |
133 |
18 |
|
|
|
|
|
20 |
4X+102 |
30 |
12 |
2X-30 |
140 |
35 |
2X-20 |
134 |
33 |
|
|
|
|
|
21 |
9X+53 |
19 |
12 |
2X-36 |
142 |
37 |
8X-19 |
135 |
8 |
|
|
|
|
|
22 |
12X+23 |
13 |
12 |
4X-11 |
135 |
14 |
11X-6 |
142 |
4 |
|
|
|
|
|
23 |
7X+23 |
24 |
19 |
6X+15 |
111 |
9 |
2X-12 |
140 |
26 |
|
|
|
|
|
24 |
5X+113 |
27 |
8 |
6X-20 |
128 |
12 |
12X-6 |
150 |
3 |
|
|
|
|
|
25 |
5X+118 |
17 |
9 |
8X+21 |
119 |
5 |
2X-14 |
146 |
24 |
|
|
|
|
|
26 |
6X+88 |
14 |
13 |
4X-35 |
115 |
25 |
11X-18 |
132 |
6 |
|
|
|
|
|
27 |
9X+129 |
24 |
3 |
8X-16 |
140 |
7 |
5X-5 |
145 |
8 |
|
|
|
|
|
28 |
6X+25 |
41 |
19 |
2X+38 |
110 |
16 |
12X-16 |
136 |
5 |
|
|
|
|
|
29 |
10X+99 |
11 |
7 |
3X-66 |
99 |
49 |
10X-17 |
147 |
5 |
|
|
|
|
|
30 |
12X+21 |
39 |
10 |
5X+26 |
114 |
8 |
6X-14 |
134 |
10 |
|
|
|
|
|
31 |
7X+97 |
27 |
8 |
2X-12 |
160 |
16 |
2X-20 |
142 |
29 |
|
|
|
|
|
32 |
9X+21 |
33 |
14 |
4X+50 |
106 |
6 |
4X-9 |
137 |
13 |
|
|
|
|
|
33 |
11X+93 |
10 |
7 |
2X-73 |
103 |
75 |
3X-8 |
131 |
19 |
|
|
|
|
|
34 |
3X+73 |
26 |
27 |
2X+32 |
140 |
4 |
6X-6 |
144 |
7 |
|
|
|
|
|
35 |
3X+57 |
39 |
28 |
3X-69 |
105 |
48 |
10X-18 |
148 |
5 |
|
|
|
|
|
36 |
3X+60 |
36 |
28 |
2X-30 |
136 |
37 |
4X-11 |
143 |
12 |
|
|
|
|
|
37 |
4X+81 |
11 |
22 |
9X-10 |
136 |
6 |
6X-15 |
141 |
9 |
|
|
|
|
|
38 |
10X+97 |
23 |
6 |
6X+26 |
118 |
6 |
10X-19 |
149 |
5 |
|
|
|
|
|
39 |
10X+17 |
23 |
14 |
2X-70 |
100 |
75 |
12X-16 |
136 |
5 |
|
|
|
|
|
40 |
7X+148 |
18 |
2 |
7X+23 |
129 |
4 |
8X-8 |
140 |
6 |
|
|
|
|
|
41 |
12X+48 |
24 |
9 |
2X+18 |
106 |
28 |
10X-11 |
131 |
6 |
|
|
|
|
|
42 |
9X+56 |
34 |
10 |
8X-40 |
100 |
15 |
12X-12 |
144 |
4 |
|
|
|
|
|
43 |
4X+64 |
24 |
23 |
5X+18 |
132 |
6 |
12X-15 |
147 |
4 |
|
|
|
|
|
44 |
4X+105 |
27 |
12 |
2X-52 |
116 |
58 |
11X-7 |
143 |
4 |
|
|
|
|
|
45 |
6X+81 |
39 |
10 |
2X+40 |
124 |
8 |
3X-11 |
131 |
20 |
|
|
|
|
|
46 |
2X+129 |
17 |
17 |
5X-10 |
140 |
10 |
8X-16 |
148 |
6 |
|
|
|
|
|
47 |
2X+83 |
29 |
34 |
3X-48 |
102 |
42 |
7X-11 |
149 |
6 |
|
|
|
|
|
48 |
4X+87 |
21 |
18 |
5X+30 |
130 |
4 |
2X-12 |
142 |
25 |
|
|
|
|
|
49 |
10X+90 |
40 |
5 |
2X+57 |
111 |
6 |
3X-20 |
131 |
23 |
|
|
|
|
|
50 |
11X+54 |
16 |
10 |
5X-13 |
153 |
8 |
12X-10 |
142 |
4 |
|
|
|
|
|
|
|
|
|
|
|
|
|
|
|
|
5 |
|
|
|
|
|
|
|
|
|
|
|
|
|
|
|
|
|
|
|
|
|
|
|
|
|
|
|
|
|
|
|
|
|
|
|
|
|
|
|
|
|
|
|
|
|
|
|
|
|
|
|
|
|
|
|
|
|
|
|
|
|
|
|
|
|
|
|
|
|
|
|
|
|
|
|
|
|
|
©Ms. Garcia Math |
|
|
|
|
|
|
|
|
|
|
|
|
|
|
|
|
|
|
|
| Name: |
|
ID: |
|
Quiz: |
|
Grade: |
|
|
|
|
|
|
|
|
|
|
|
|
|
|
|
|
|
|
|
|
| Benchmark |
|
|
|
|
| 1 |
|
|
|
|
|
|
|
|
? |
|
|
|
|
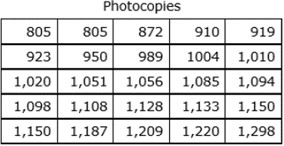
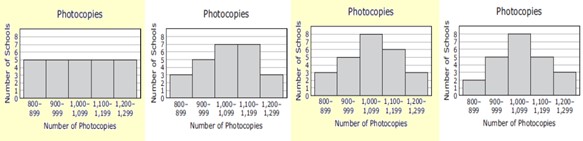
The table shows the number of photocopies made during one day at each of the 25 schools in a school district.
Which histogram displays all the data in the table correctly? |
 |
|
|
|
|
|
|
|
|
|
|
|
|
|
|
|
|
|
|
|
|
 |
|
|
|
|
|
|
|
|
|
|
|
|
|
|
|
|
|
|
|
A |
|
B |
|
C |
|
D |
|
|
|
|
|
|
|
|
|
|
|
|
|
|
|
|
|
|
|
|
|
| 2 |
|
|
|
|
|
|
|
|
? |
|
|
|
|
| After 4 new students joined a class, the class had 32 students. Which equation can be used to find n, the number of students in the class before the 4 new students joined? |
|
|
|
|
|
|
|
|
|
|
F |
n/4=32 |
|
|
|
|
|
G |
n - 4 = 32 |
|
|
|
|
|
H |
4n = 32 |
|
|
|
|
|
J |
n + 4 = 32 |
|
|
|
|
|
|
|
|
|
|
|
|
|
|
|
|
|
|
|
| 3 |
|
|
|
|
|
|
|
|
? |
|
|
|
|
The list shows the numbers of employees in the nine departments at a company.
14, 23, 6, 54, 30, 26, 17, 3, 26
What is the range of the numbers of employees in these departments? |
|
|
|
|
|
|
|
|
|
|
|
|
|
|
|
|
|
|
|
|
A |
23 |
|
|
|
|
|
B |
51 |
|
|
|
|
|
C |
26 |
|
|
|
|
|
D |
18 |
|
|
|
|
|
|
|
|
|
|
|
|
|
|
|
|
|
|
|
| 4 |
|
|
|
|
|
|
|
|
? |
|
|
|
|
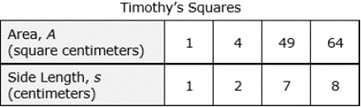
Timothy has a set of plastic squares. The table shows the relationship between A, the area of each square in square centimeters, and s, the side length of each square in centimeters.
Which equation can be used to represent the relationship between A and s for these squares? |
|
|
|
|
 |
|
|
|
|
|
F |
A = s |
|
|
|
|
|
G |
A = s • s |
|
|
|
|
|
H |
A = 2 + s |
|
|
|
|
|
J |
A = s + s |
|
|
|
|
|
|
|
|
|
|
|
|
|
|
|
|
|
|
|
| 5 |
|
|
|
|
|
|
|
|
? |
|
|
|
|
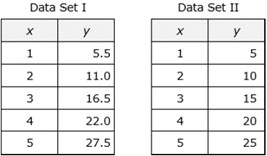
The tables show the relationships between x and y for two data sets.
Which statements describe the relationships between x and y in Data Set I and Data Set II? |
 |
|
|
|
|
|
|
|
|
|
|
|
|
|
|
|
|
|
|
|
|
A |
Both data sets show additive relationships. In Data Set I, y is 5.5 more than x, and in Data Set II, y is 5 more than x. |
|
|
|
|
|
B |
Data Set I shows a multiplicative relationship in which y is 5.5 times x. Data Set II shows an additive relationship in which y is 20 more than x. |
|
|
|
|
|
C |
Both data sets show multiplicative relationships. In Data Set I, y is 5.5 times x, and in Data Set II, y is 5 times x. |
|
|
|
|
|
D |
Data Set I shows an additive relationship in which y is 4.5 more than x. Data Set II shows a multiplicative relationship in which y is 5 times x. |
|
|
|
|
|
|
|
|
|
|
|
|
|
|
|
|
|
|
|
|
|
|
|
|
|
|
|
|
|
|
|
|
|
|
|
|